Crack width control in FRC segments Feb 2020
Load tests carried out on precast segments of fiber reinforced concrete in the Laboratory of Materials and Structures of the Civil Engineering Department of the Rome University Tor Vergata conclude that steel fibre reinforcement can control hardening post crack width and behavior to 0.05mm.
Two kinds of tests were performed on segments used typically in water tunnels:
- a test simulating point load effects produced by the back thrust of the TBM during excavation, and
- a flexural test simulating the behaviour of the segments when loaded under bending.
The tests were performed on two segments reinforced only with 40kg/m3 of Dramix® 4D 80/60BG steel fibre of 60mm long. This is a mix design that is typical in segment production in terms of cost and performance.
The tests were carried out on precast segments of 250mm thick, about 1,670mm long and 1,200mm wide (Fig 1). Both segments were made from the same batch of concrete, as were the beams and cubes for the material characterization tests (Table 1).
The average compressive strength of the fibre reinforced material, measured on eight 150mm cubes, was equal to 61.20 MPa.
Beam test procedure
The tensile behaviour was characterized through bending tests on nine 150mm x 150mm x 600mm notched specimens (Fig 2) according to the EN 14651 code:
The material can be classified as 5e according to Model Code 2010. In fact, the characteristic value of fR1k is higher than 5 MPa and the ratio between fR3k and fR1k is equal to 1.37, so higher than 1.3.
The results of the beam bending tests are illustrated in Fig 4 and Table 2.
| Table 2 Results of the beam bending tests | |||||
| fL [Mpa] | fR1 [MPa] | fR2 [MPa] | fR3 [MPa] | fR4 [MPa] | |
| Beam 01 | 4.68 | 6.70 | 7.86 | 7.69 | 7.47 |
| Beam 02 | 4.90 | 6.28 | 8.49 | 8.20 | 7.58 |
| Beam 03 | 4.78 | 6.45 | 8.41 | 8.42 | 8.04 |
| Beam 04 | 5.15 | 6.56 | 9.04 | 8.64 | 7.44 |
| Beam 05 | 5.72 | 7.33 | 8.95 | 8.75 | 8.19 |
| Beam 06 | 5.03 | 6.27 | 8.60 | 9.23 | 8.45 |
| Beam 07 | 5.63 | 7.75 | 10.2 | 8.99 | 8.54 |
| Beam 08 | 4.60 | 6.28 | 8.16 | 9.25 | 8.40 |
| Beam 09 | 5.43 | 6.18 | 8.03 | 8.50 | 8.33 |
| Average | 5.10 | 6.64 | 8.64 | 8.63 | 8.05 |
| Characteristic | 4.30 | 5.58 | 7.26 | 7.65 | 7.19 |
Segment test procedure
For the bending tests, one point load and one flexural test was carried out. The test was performed by adopting a 1000kN electromechanical jacket, with a PID control and by imposing a stroke speed of 10µm/sec (Fig 5 and 6).
During the test, the following measures were continuously registered:
- the load F, measured by means of a 1,000kN load cell with a precision of 0.2%;
- the midspan displacement, measured by means of three potentiometer wire transducers placed along the transverse line; and
- the crack opening at midspan, measured by means of two LVDTs.
Furthermore, the crack pattern was recorded at different intervals, with the help of a 100mm x 100mm grid plotted on the intrados surface.
It is worth noting that the bending test was carried out in displacement control, using an electromechanical jack, up to the collapse. The cracking phase is highlighted during the test.
The displacements measured by the three wire transducers are plotted versus the load (Fig 5). No appreciable torsion was found, as the three wire transducers measured almost coincident displacements. The maximum load was about 254kN.
The point load test was performed by applying two point loads to the segment, using the same type of thrust jack shoes as used on a TBM. A uniform support is considered, as the segment is placed on a stiff beam suitably designed. Every jack, having a loading capacity of 2,000kN, is inserted in a closed ring frame made with HEM 360 steel beams and 50mm diameter Dywidag bars (Fig 6).
The load was continuously measured by pressure transducers. Four potentiometer transducers, two located at the intrados and two at the extrados, measured the vertical displacements, while one LVDT transducer, applied between the load pads, measured the crack openings.
Bending test results
The first crack for the bending test on the segment and as measured by the three wire transducers, appears for a load value of about 170kN at the intrados surface close to the midspan of the segment and propagates on the lateral surfaces (Fig 7). The maximum crack width is about 0.05mm
For a load level of 200kN a new crack forms at the intrados surface and propagates on the right lateral face. Furthermore, a widening and lengthening of the already formed crack takes place (Fig 8). The maximum crack width is about 0.25 mm
For the point loading test, load was applied through time (Fig 8). For this report it is worth noting that the term load in this report refers to the single shoe.
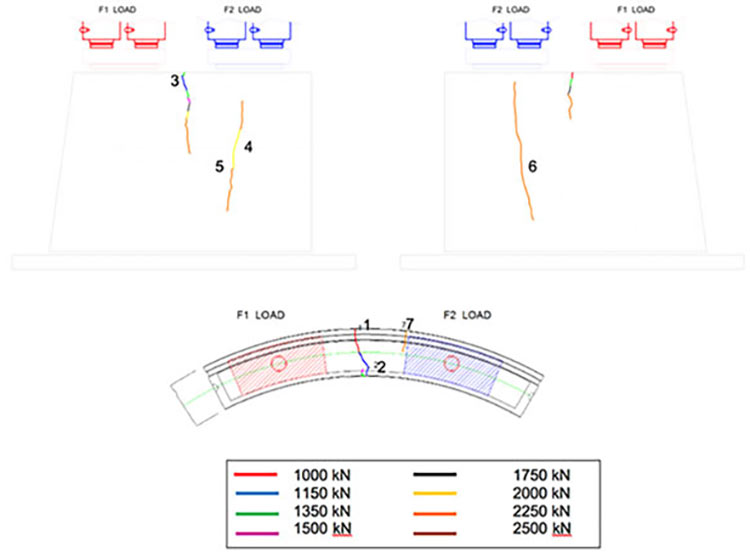
During the test, the first crack appeared for a load level of 1,000kN for each steel pad, between the two shoes and at the top and extrados surface (Fig 9). This spalling or splitting crack propagates through the extrados and intrados surfaces with:
- a maximum crack width of lower than 0.05mm under a load of up to 1,750kN and
- a bursting crack opening under a load level of about 2,000kN (F2 in Fig 10) and extending for a length of about 80cm at the intrados and about 100cm at the extrados.
The maximum crack width measured with a crack gauge during the test was equal to about 0.35mm. The maximum crack width at the end of the test, after complete unloading, was about 0.05mm (Fig 10 and Table 3).
| Table 3. Measured crack widths during the point load test | |||||||||
| Crack name (Fig10) | Crack width [mm] | ||||||||
| 1000 [kN] |
1150 [kN] |
1350 [kN] |
1500 [kN] |
1750 [kN] |
2000 [kN] |
2250 [kN] |
2500 [kN] |
0 [kN] | |
| 1 | <0.05 | <0.05 | <0.05 | 0.05 | 0.05 | 0.10 | 0.30 | 0.35 | 0.05 |
| 2 | - | <0.05 | <0.05 | <0.05 | 0.05 | 0.10 | 0.10 | 0.10 | 0.05 |
| 3 | - | - | - | <0.05 | 0.05 | 0.10 | 0.20 | 0.20 | <0.05 |
| 4 | - | - | - | - | - | <0.05 | <0.05 | <0.05 | <0.05 |
| 5 | - | - | - | - | - | - | 0.05 | 0.10 | <0.05 |
| 6 | - | - | - | - | - | - | 0.15 | 0.20 | 0.05 |
| 7 | - | - | - | - | - | - | <0.05 | <0.05 | 0 |
The technical report for the results of a test approach to simulate bending and concentrated point load on a precast steel fibre reinforced concrete segment, shows that:
- hardening post crack behaviour at the section level (beam test) allows for immediate cracking control to the SLS (serviceability limit state) design, and
- validates a maximum crack opening for design approach based on the Model Code 2010 and includes the new generation of high performance fibre, with high tensile strength (> 1,800MPa), optimized anchorage and a high length:diameter ratio of greater than 80 and at a dosage that provides a minimum network of 10,000lm of reinforcement per m3 of concrete.
References
- Fibre-reinforced concrete for precast segments – TunnelTalk, May 2014
- Review of FRC brittle failure considerations – TunnelTalk, March 2015
- SFRC durability in a chlorinated environment – TunnelTalk, April 2016
- 20 years of fibre concrete linings in the UK – TunnelTalk, October 2010
|
|
|
|
|
Add your comment
- Thank you for taking the time to share your thoughts and comments. You share in the wider tunnelling community, so please keep your comments smart and civil. Don't attack other readers personally, and keep your language professional.


